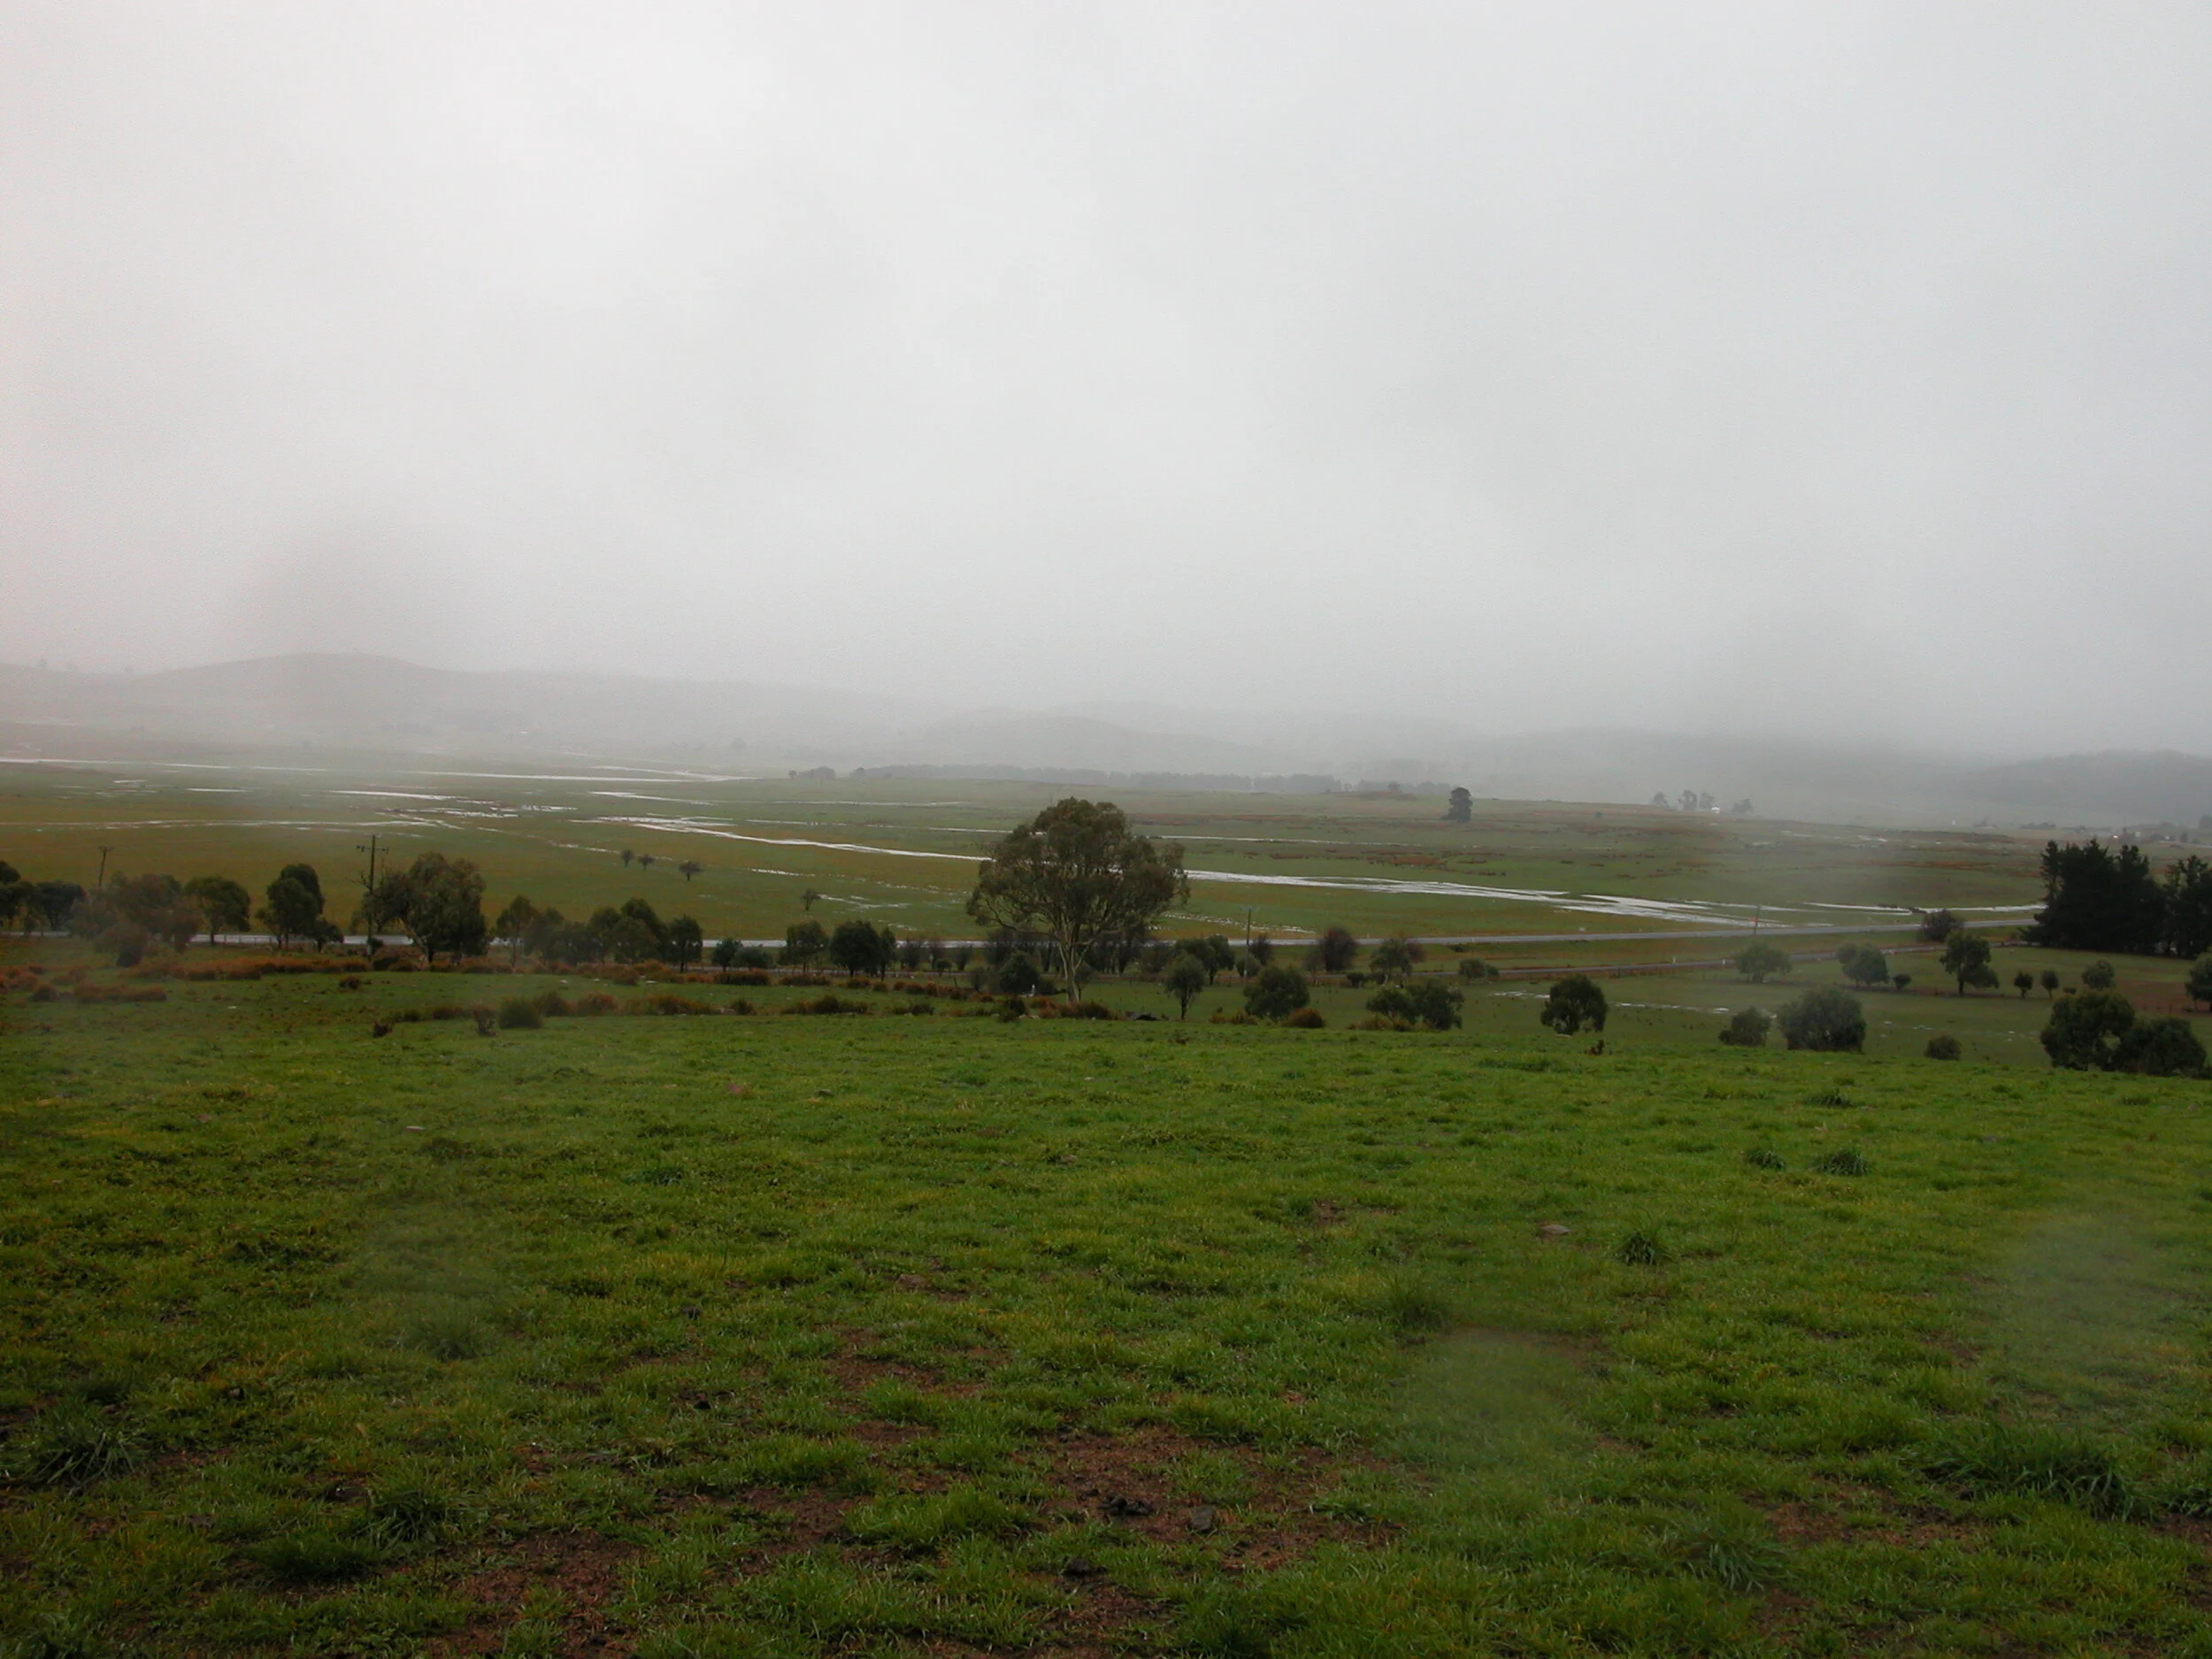
Note to Yarns from the Farm readers: this is the seventh instalment of a series on climate change that I’m writing for our local monthly newsletter, the Southern Midlands Regional News (SMRN). The first article is here, the second here the third here, the fourth here and the most recent here and here. The image above is taken from the lower part of my farm, looking across the Oatlands valley during the flood of 2016.
Runoff is a bit like warfare— months of boredom punctuated by moments of extreme terror.
The vast majority of runoff occurs in extreme events, usually involving flooding and erosion. In between times, the system more or less just sits there “looking stupid” as my friend, ecologist Graham Harris, describes it.
All water supplies ultimately rely on surface runoff or groundwater accumulation. Here, we’ll focus on runoff, since groundwater has its own unique complexity.
The last big rainfall event in the Southern Midlands was during winter of 2016, so our water supplies have been living off the associated flooding for four years of runoff boredom.
Even with reasonable autumn rains this year, we saw little runoff into farm dams until the 50 mm over 3 days we just received.
Let’s take Lake Dulverton as an example. While it is not a municipal water supply, it is a community amenity: aesthetic, environmental and recreational. Maintaining a viable water level in the lake is a priority for community.
Before we launch into the details, I need to back up and explain the various ways water is lost through evaporation. The standard measurement is called ‘pan evaporation’— water in a shallow pan is allowed to evaporate and the rate of water lost from the pan is measured directly.
Unfortunately, pan values are not representative of actual evaporation either from larger bodies of water (the edge effects of the pan overestimate observed evaporation from a lake by about 30%) or from soils with ground cover, where evaporation can vary from a fraction of pan levels to values that exceed pan levels in pastures or tree plantations where lots of plant transpiration is occurring.
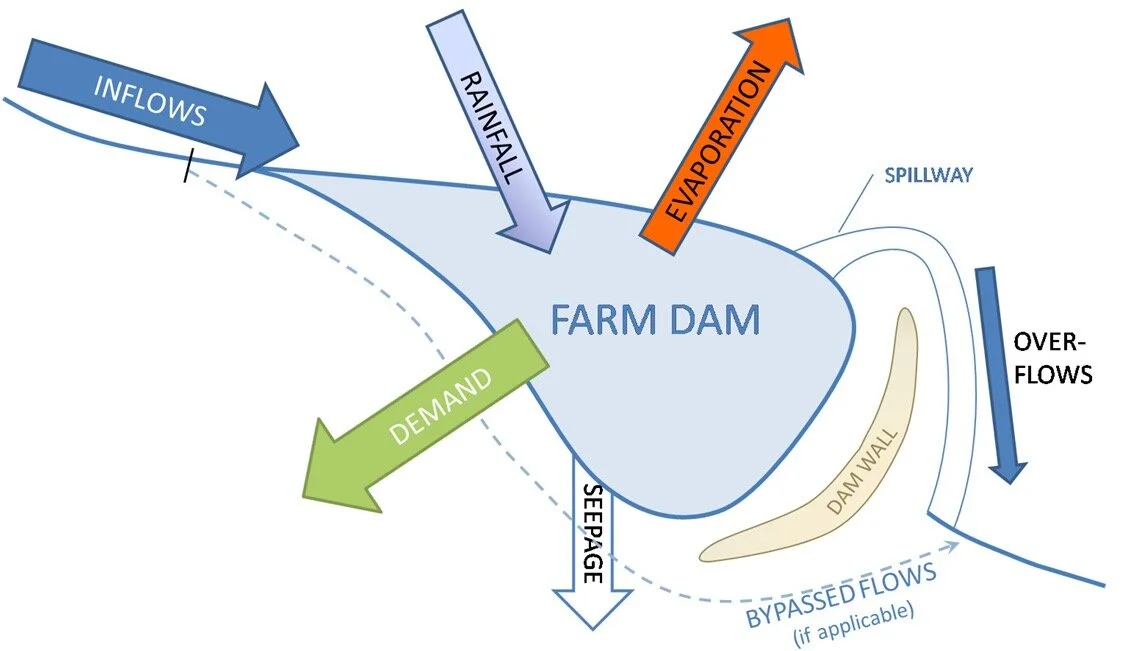
Except for the demand amount (zero) and the average rainfall, the variables in the schematic are all difficult to estimate. Let’s give it a try anyway.
Lake Dulverton, with an area of 2.3 km2, gets 600mm of rainfall and loses about 770mm in evaporation each year, on average. This translates into a net loss of 400 megalitres (ML), and net drop in water level of 170mm per year, in the absence of runoff and seepage.
The catchment area for Lake Dulverton is 34 km2. It receives the same 600mm annual rainfall as the lake, but evaporation from land is different from that over bodies of water. For eastern Tasmania, the Bureau of Meteorology estimates soil moisture evaporates at an average rate of 600mm/year.
This average scenario is exactly the system sitting there looking stupid and boring: rainfall is essentially cancelled out by plant and soil evaporative processes, and there is little or no runoff from the catchment. For significant runoff, we need a large enough downpour in a short enough span of time for rainfall to temporarily exceed evaporation, saturate the soil and run off into seasonal creeks.
In June 2016 the catchment received 125mm over 3 days. If all of that rainfall turned into runoff, Lake Dulverton would have seen about 4000ML of inflow. However, only a fraction would actually reach the lake, as every stream bed in the catchment is interrupted by farm dams. The June 2020 event, at 50mm, would generate a total runoff of about 1700ML.
Over the next 20 years, evaporation in our area is forecast to increase by 7% and rainfall to decrease by 3%. For Lake Dulverton, this means the net evaporative loss will increase to about 600ML per year. In the next article, we’ll take a look at the statistics around extreme events, including the big rainfall events needed for runoff, as climate changes.